

|
|
|
|
|
|
|
|
|
|
|||||||||
 |
 |
 |
|
||||||||||||||
|
|
|
|
|
||||||||||||||
 |
|
 |
|
||||||||||||||
 |
|
 |
|
||||||||||||||
|
|
|
||||||||||||||||
 |
|
||||||||||||||||
 |
|
||||||||||||||||
|
|
|
||||||||||||||||
 |
|
||||||||||||||||
|
|
 |
 |
|
||||||||||||||
 |
|
||||||||||||||||
 |
|
||||||||||||||||
|
|
|
||||||||||||||||
|
|
|
|
|
||||||||||||||
|
|
|
||||||||||||||||
 |
 |
|
|||||||||||||||
|
|
|
|
|
|
|
|
|
|
|
|
|
|
|
|
|
|
|
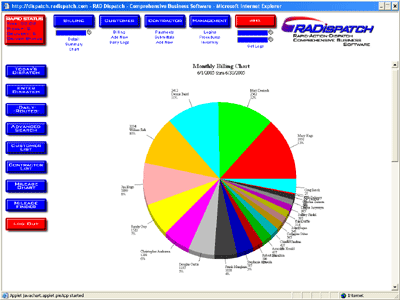
Charts and Reports screen
The reports that can be generated within RADispatch all have the ability
to show charts. Whether it's a pie chart, bar graph, stacked bar graph,
or stacked
column chart, it's easier to read reports containing charts. Some of the
reports included are:
Agent Productivity
Customer Activity
Income Projections
Average Delivery per Customer or Agents
Company Health/Trending
On-time/Late Deliveries
plus many others...
Advanced Search
Charts and Reports screen...
